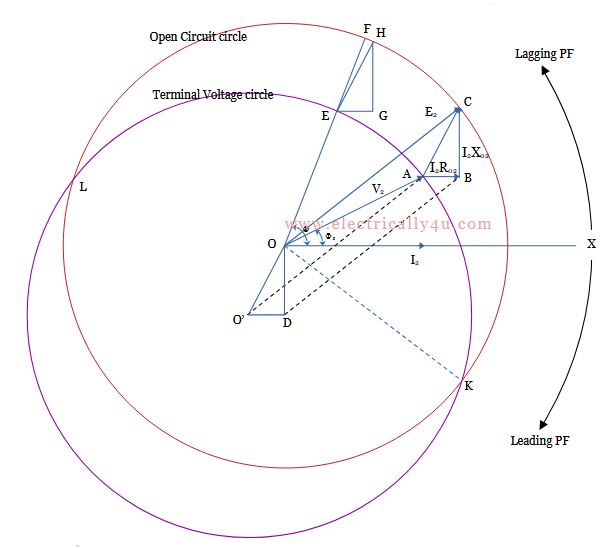
Kapp regulation diagram of transformer

The Kapp regulation diagram is a graphical method of determining the voltage regulation in a transformer. It was proposed by late Dr. Kapp and hence the name Kapp regulation diagram or simply Kapp diagram. Using this diagram, it is possible to determine the voltage drop or voltage rise.
As you know, the secondary terminal voltage decreases with the increase in load on the transformer in the case of inductive load (lagging power factor) and may increase with the increase in load in the case of capacitive load (leading power factor). It implies that the secondary terminal voltage not only depends on the load but on the power factor also.
For drawing the Kapp regulation diagram, it is necessary to know the equivalent resistance and reactance of the transformer as referred to secondary i.e. R02 and X02.
The Kapp regulation diagram is shown in the Figure below. To start with, consider the load current, I2 as the reference phasor and draw a line OX to represent the reference phasor. On load condition, the secondary current I2 lags behind the secondary terminal voltage V2 by an angle Φ2. It is represented by drawing a phasor OA inclined at an angle Φ2 to OX, where cos Φ2 is the power factor of the load.

The resistance drop referred to secondary, I2R02 is drawn as AB parallel to the current phasor OX from the extremity of the OA phasor. The reactive drop referred to secondary, I2X02 is drawn as BC perpendicular to the current phasor OX from B.
Join AC, which is the total voltage drop. Now, the triangle ABC is called the impedance triangle referred to the secondary.
Join OC, which is the secondary no-load voltage E₂ and the arithmetic difference (OC-OA) is the secondary drop from no load to full load.
Now if the triangle ABC is transferred to OO’D, as shown, then O’A = OC = E2. Hence for a given secondary current, the locus of C is a circle with center O and radius E2 known as an open circuit circle. The locus of A is a circle of radius E2, with center O’ known as a terminal voltage circle.
In order to determine the voltage drop on full load at any power factor cos Φ2, a radius OEF is drawn inclined at an angle Φ to OX. If the impedance triangle is drawn in the position HEG, then OH = OF = E₂, the secondary no-load voltage, and OE = V2, the secondary voltage on load. Hence length EF represents the voltage drop. However, the triangle HEG is not mandatory to draw.
The Kapp regulation diagram is very helpful in determining the variation of regulation with power factor, but it has the disadvantage that since the lengths of the sides of the impedance triangle are very small in comparison to the radii of the circles, the diagram has to be drawn on a very large scale for accuracy.


