Phasor Diagram and Phasor Addition
Phasor Diagram is a graphical representation of the relation between two or more alternating quantities in terms of magnitude and direction. In other words, it depicts the phase relationship between two or more sinusoidal waveforms having the same frequency.
Phasor is a straight line with an arrow at one end, rotating in an anticlockwise direction. The length of the line represents the magnitude of the sinusoidal quantity and the arrow represents the direction. Learn how to represent a phasor.
Phasor diagram
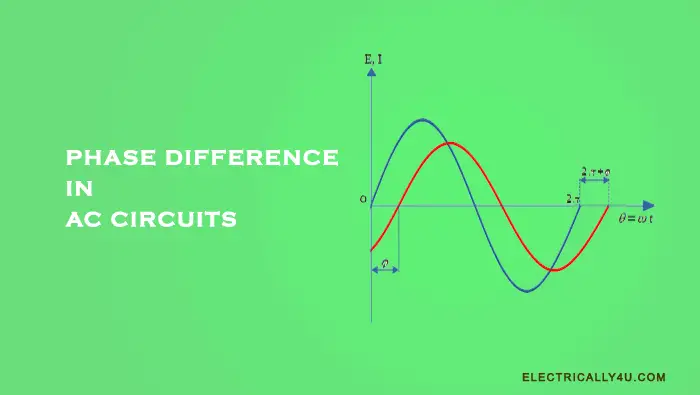
Let us consider two sinusoidal AC waveforms as shown below, in which the current(i) lag behind the voltage(v) by an angle φ.
The phasor diagram is drawn corresponding to time zero on the horizontal axis as the reference. The length of the phasor is proportional to the voltage or current that is considered at any instant.
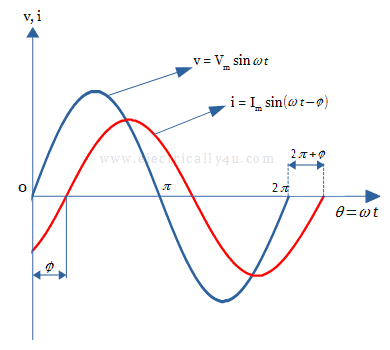
In this waveform, assume the phase difference or phase shift be φ = 300. While drawing the phasor diagram, one phasor is designated as a reference phasor. The other phasors are drawn either by lagging or leading with respect to the reference axis.
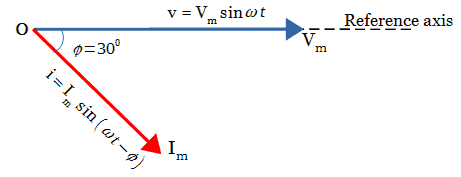
If you observe the above waveform, the voltage waveform(v = Vm sin ωt) starts at time zero on the horizontal axis. Hence it is designated as the reference phasor. So it is drawn along the horizontal reference axis as shown below in blue color.
The current waveform(i = Im sin ωt) reaches the horizontal axis with a delay by an angle of φ = 300, called the lagging phase difference. As the phasors are rotating in an anticlockwise direction, the current phasor is drawn behind the voltage phasor by 300 as shown below in red color.
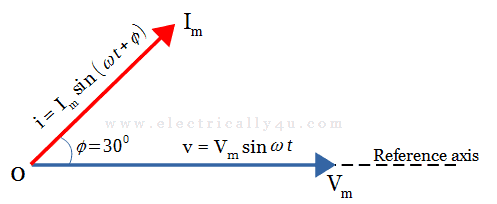
On the other hand, if the current waveform is ahead of the voltage by the same angle φ = 300, it is called the leading phase difference. In this case, the phasor for the current is drawn ahead of the voltage phasor in the anticlockwise direction by angle 300.
Phasor Addition
Most of the time, we deal with two or more alternating quantities in AC circuit analysis. In such cases, it is necessary to add or subtract two or more sinusoidal waveforms having the same frequency. It can be done either by graphical method or by analytical method.
Let us take a look at those two methods in detail.
Graphical Method
In this method, the addition or subtraction of two waveforms is done by plotting the phasors on the scale. If two waveforms are in-phase with each other, they can be added similar to the addition of two DC values.
For example, let us consider two AC voltages V1 = 25 V and V2 = 30 V, which are in-phase with each other. They can be added together to get the total voltage of VT = V1 + V2 = 25 + 30 = 55 V. Its phasor diagram is shown below.
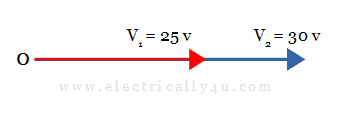
Phasor addition of two phasors
To add two sinusoidal waveforms that are out of phase with each other, their phase angle must be considered.
Choose a phasor as a reference and draw it along the X-axis. Now, draw the other phasors at that instant, one after another. To get the resultant phasor, join the origin of the first phasor and the endpoint of the final phasor.
Now, the length of the phasor from origin to the last point represents the magnitude of the resultant phasor. The angle formed by the resultant phasor with respect to the reference axis represents the phase angle.
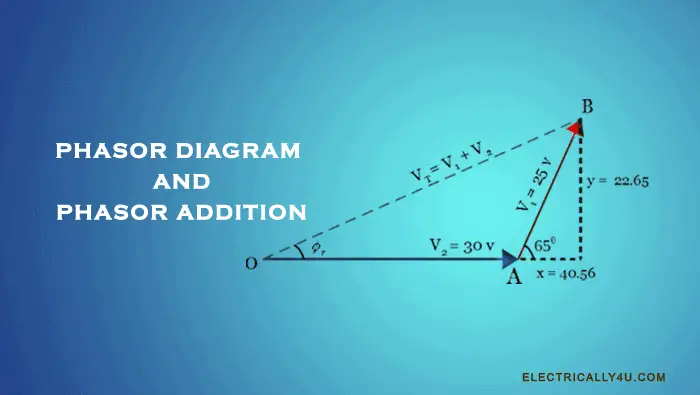
For example, let us consider two voltages V1 = 25 V and V2 = 30 V respectively, where the voltage phasor V1 is rotating ahead (leading) of the voltage V2 by some angle, say φ = 650.
Since voltage phasor V1 leads the other voltage phasor V2, consider V2 phasor as a reference. Hence, draw the phasor V2(OA) on the reference axis as shown in the figure below. From the endpoint(A) of the first phasor, draw the other phasor V1(AB) with an angle 650 with respect to the reference axis.
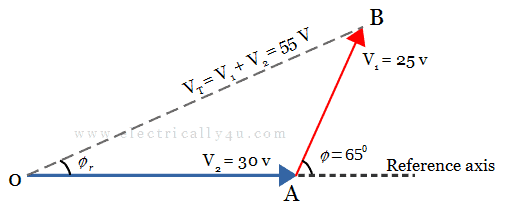
Now join the origin(O) and endpoint of the final phasor(B). OB is the resultant phasor, whose magnitude is given by the length of OB(VT = 55 V) and phase angle is given by ∠AOB = ϕr.
Analytical method
Using this method, the phasors are represented in rectangular form. In rectangular form, a phasor is represented by a generalized equation Z = x ± jy, where ‘x’ is the real part and ‘y’ is the imaginary part. Using this generalized equation, a sinusoidal voltage is expressed as,
![]()
Here, the real part is x = Vm cosϕ and the imaginary part is y = Vm sinϕ
Let A and B are two phasors, which are represented in rectangular form as,
![]()
For phasor addition, add the real and imaginary part of the two phasors individually as, ,
![]()
Similarly, for phasor subtraction, the resultant phasor is obtained as,
![]()
Learn about the rectangular form of representation of phasor.
Phasor addition using rectangular form
Consider two voltages V1 = 25 V and V2 = 30 V respectively, where the voltage V1 leads the voltage V2 by an angle φ = 650.
Using the generalized expression for rectangular form, the voltage phasor V1 and V2 can be written as
![]()
![]()
Since V1 is leading, the voltage phasor V2 is along the reference axis(which is the horizontal zero axis). It has a horizontal component but no vertical component. Thus the rectangular form for voltage V2 is given by,
![]()
The voltage V1 = 20 V leads voltage V2 by 65o, hence it has both horizontal and vertical components. The rectangular form for voltage V1 is given by,
![]()
The resultant voltage phasor is obtained by adding the above two phasors as,
![]()
![]()
![]()
The resultant voltage phasor has both real part x = 40.56 and imaginary part y = 22.65, which are horizontal and vertical components respectively.
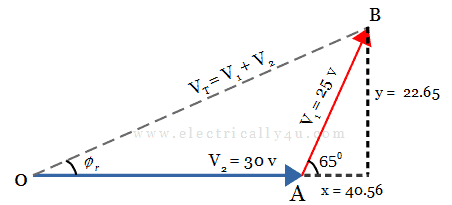
Using Pythagorus theorem, the magnitude of the total voltage can be obtained as,
![]()
![]()
The resultant phase angle is obtained from the formula,
![]()
Learn about the Polar form of representation of phasor.

